Exploring workplace dynamics: the impact of organizational factors on teachers’ job satisfaction in Colombo, Sri Lanka
Explorarea dinamicii la locul de muncă: impactul factorilor organizaţionali asupra satisfacţiei profesionale a profesorilor din Colombo, Sri Lanka
Abstract
The objective of this study is to assess the job satisfaction of teachers from Colombo, Sri Lanka. Purposive random sampling techniques was used to collect data from 225 teachers, in 20 provincial government administered schools. The structured questionnaire consisted in 30 questions, being prepared andanalyzed using theSPSS program. The questions were categorized into job satisfaction on nature of work, working conditions, payment, training and development, self-esteem, job autonomy, promotion, interpersonal relations and educational policy, administration and leadership. The results revealed that overall job satisfaction was reported by more than 60% of the respondents. The mean values revealed by the factors according to ranks referred to the following variables: interpersonal relation, job autonomy, self-esteem, nature of work, working conditions, promotion, training and development, educational policy, administration and leadership, and, finally, payment. Interestingly, the result clearly shows that payment is the least contributing factor to the job satisfaction.Keywords
job satisfactionSri LankaColomboeducational areaRezumat
Scopul acestui studiu a fost de a evalua satisfacţia profesională a profesorilor din Colombo, Sri Lanka. Au fost utilizate tehnici de eşantionare aleatorie intenţionată pentru a colecta date de la 225 de profesori, din 20 de şcoli administrate de guvernul provincial. Chestionarul structurat, format din 30 de întrebări, a fost pregătit şi analizat folosind programul SPSS. Întrebările au fost structurate pe categorii privind satisfacţia legată de natura muncii, condiţiile de lucru, salariul, formarea şi dezvoltarea, stima de sine, autonomia în muncă, promovarea, relaţiile interpersonale şi politica educaţională, administrarea şi leadershipul. Rezultatele au arătat că peste 60% din respondenţi au raportat satisfacţie profesională generală. Valorile medii relevate de factori în funcţie de ranguri s-au referit la următoarele variabile: relaţii interpersonale, autonomie în muncă, stimă de sine, natura muncii, condiţii de lucru, promovare, formare şi dezvoltare, politică educaţională, administrare şi leadership şi, în cele din urmă, salariu. În mod interesant, rezultatele evidenţiază faptul că salariul are contribuţia cea mai mică la satisfacţia profesională.Cuvinte Cheie
satisfacţie profesionalăSri LankaColombozonă educaţionalăIntroduction
In recent education reform and restructuring, one focus has been on developing ways to improve staff commitment to schools in general and to the initiatives undertaken, and the processes of implementation, in particular (Joyce & Calhoun, 1998; Lielberman & Grolnick, 1996)(5,7). Darling- Hammond (1995) emphasized that traditionally rigid, bureaucratically administered schools have not succeeded in implementing change in education reform, whereas schools using collective or collaborative problem-solving strategies based on an underlying sense of commitment have succeeded(1). Without commitment, substantive change becomes problematic, if not impossible, to make in a manner that will address more than just superficial issues (Senge, 1990)(11).
The relevance of job satisfaction and motivation is crucial to the long-term growth of any educational system around the world. They probably rank alongside professional knowledge and skills, center competencies, educational resources and strategies as the veritable determinants of educational success and performance. Professional knowledge, skills and center competencies occur when one feels effective in one’s behavior. In other words, professional knowledge, skills and competencies can be seen when one is taking on and mastering challenging tasks directed at educational success and performance (Filak & Sheldon, 2003)(3). The aforementioned factors are closely linked to efficacy and, of course, it is well known that many teachers lose or fail to develop self-efficacy within educational settings (Dweck, 1999)(2). In addition, needs satisfaction and motivation to work are essential in the lives of teachers, because they form the fundamental reason for working in life. While almost every teacher works in order to satisfy his or her needs in life, he or she constantly struggles for need satisfaction. Job satisfaction in this context is the ability of the teaching job to meet teachers’ needs and improve their job/teaching performance.
Employee job satisfaction is essential to the success of any business to thrive. Poor job satisfaction is directly influencing on the organizational success (Gunram, 2011)(4). The elements of job satisfaction are related to the nature of work, good payment, promotion, job security, autonomy, supervision, and pleasant colleagues (Luthans, 1985; Sharif & Nazir, 2016)(8,13). Job satisfaction is the feeling of an individual towards his/her job, where the employee shows positive emotions that derives from his/her personal experience, job or appraisal (Luthans, 1985)(8). Many researchers have shown the positive correlations between job satisfaction and institutional output (Latif et al., 2015)(6). An employee who has no interest in his or her job, in which he or she begins in a job, may initially put forth his or her best effort. However, this employee will often become bored with the work, because there is no intrinsic motivation to succeed. Thus, keeping employees satisfied with their job should be a major priority for every organization.
Teachers are the heart of theeducational sector in any country. The job satisfaction of a teacher plays a significant role in the field of education (Nyakundi, 2012)(10). Moreover, teachers’ commitment and effectiveness solely depend on motivation, morals, and job satisfaction (Shann, 2001)(12). The job satisfactions of the teachers influence their professional preparation, the desirable level of mastery of the subject matter to be taught, and pedagogical training for teaching. Sri Lankan government tries to motivate the teachers in many ways and means.
The government of Sri Lanka allocates a considerable amount of fund for education and health from the annual budget. There are more than 212,683 teachers serving to educate the children in this country (Ministry of Education, 2008)(9), where teachers job satisfaction fluctuates from place to place. There are 404 government schools in the Colombo district, with a student population of 375,187, where, altogether, 17,740 teachers are providing their services.
The newly appointed teachers initially work with enthusiasm and dedication, but eventually their commitment and professional interest decline. In between their service, almost soon after five years, we areable to observe some sort of reluctance in their career. The attitudes of the school principals also exert some pressure on the teachers’ lack of motivation. Moreover, provincial council school teachers receive less appreciation from the school community for their commitment. Then the teachers feel unhappy with their work, thus leading to reduced job satisfaction. Consequently, it’s unfortunate to note that the teachers are not willing to go and serve at Colombo Central and Colombo North area schools.
They complain that the urban slums children learning in the classroom are uncontrollable. They do not understand the value of the education. Therefore, most of the teachers expect to retire prematurely, provided they are offered a special retirement scheme from the Ministry of Education. Therefore, the teachers who are working in Colombo Central and Colombo North schools have no sound job satisfaction. There is a research gap on this area to assess the factors affecting the job satisfaction of teachers working in the Colombo district schools. Therefore, the objective of this study was to assess the factors influencing the teachers’ job satisfaction among the Colombo district schools. Finally, we reexamined working with teachers’ schools, considering our employing an entire population of teachers to examine the issues of job satisfaction.
Materials and method
Study area
This study was carried out in Teacher Centre – Colombo Zone’s provincial government schools, which are under the department of education in the western province of Sri Lanka. The education zone of Colombo is one of the key education areas in the western province. This education zone is divided into four divisional educational areas, namely Colombo North, Colombo Central, Colombo South, and Borella. The Teacher Centre Colombo consists in 143 schools, of which 21 are national schools, 103 are provincial schools, and 19 are semi-government schools. For this study, only the provincial secondary schools were selected for sampling. Out of those 103 provincial schools, eight of them are 1AB schools, thirty-six are 1C schools, and forty-seven are type-2 schools. Type AB – schools with GCE (A/L), science stream only, or with GCE (A/L), non-science streams, type C – GCE (A/L), non-science streams only, and type 2, from grade 1 to 11, represent all three types of the schools.
Sample collection
The main source of collecting primary data is the conduct of sample survey of school teachers in the Colombo Teacher Centre. The following assumptions have followed in the selection of sample schools and teachers: only the provincial schools which are under the department of education – Colombo zone, Teacher Centre, Colombo, were selected. The teachers represented different type of schools, including type 1AB, 1C and type 2 of provincial government schools, and the sample population represented the both Sinhala and Tamil medium teachers from those schools.
The samples were selected based on purposive random sample methods to select the sample schools based on our criteria.
The sample composition is listed in Table 1, where two hundred questionnaires were received out of two hundred and twenty-five issued to the teachers in the aforementioned allocated manner, to find out teacher’s job satisfaction.
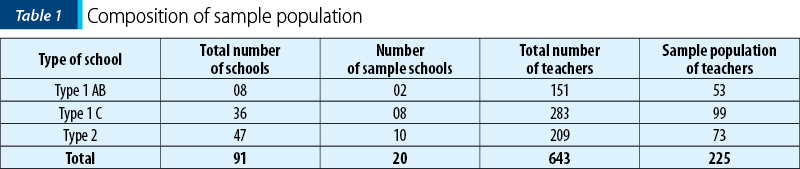
We’ve selected twenty provincial schools based on teacher centre – Colombo Zone for this study. The sample collection was conducted by two methods, using questionnaires and focus group discussions. To assure validity and reliability of the research, thestructured questionnaire has beenused in both Sinhala language and Tamil language to gather information from the respondents.
The researchers have planned to have a focus group discussion with ten teachers representing all three types of schools, including type 1AB, 1C and type 2, but only seven teachers participated in the focus group discussion, representing all three types of schools. This focus group discussion was organized to get in-depth information and views from the teachers.
Data analysis
The data were analyzed using the SPSS (Statistical Package of Social Science) 17 version. SPSS helps to keep track of whether a variable is continuous (truly numerical) or categorical (or “nominal”). Researchers used SPSS to show the following descriptive statistics for each variable: the mean, median and mode, standard deviation, and standard error. The data were interpreted by the researcher.
Results
Descriptive statistics, such as mean value of each variable and its statements on job satisfaction survey scores across all 200 respondents, are presented in Table 2. At question 1, 5.5% of the respondents responded that they were strongly dissatisfied, while 3.5% of the respondents were dissatisfied. A significant number of respondents (39.5%) agreed with question 1. Anyway, 21% of the respondents were neutral, neither satisfied, nor dissatisfied. Regarding the second question, 5% and 11% of the respondents strongly disagreed and disagreed. There were 34.5% and 21.5% of the respondents who agreed and strongly agreed with the respective statement. However, 28% of the respondents were neutral, neither agreed, nor disagreed with question 2. Regarding the third statement, 7.5% of the respondents strongly disagreed, while 33.5% of the respondents disagreed. There were 25.5% and 6.5% of the respondents who agreed and strongly agreed with the question 3. However, 27% of the respondents were neutral, neither satisfied, nor dissatisfied.
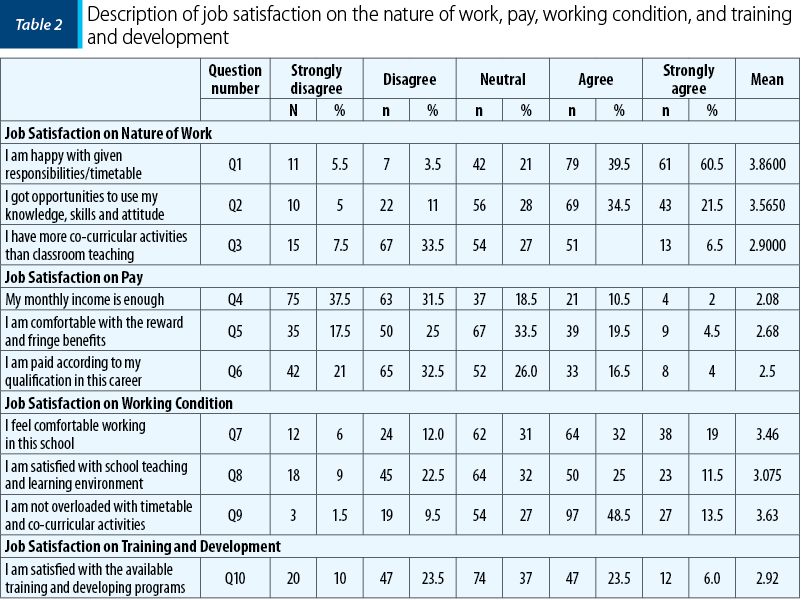
Table 2 depicts the frequency and percentage for the job satisfaction level on teachers’ payment in Colombo Zonal department of education. The mean value of statement one is 2.08, for the second statement it is 2.68, and for the third statement it is 2.5, respectively. In Table 2 it is seen that, at the fourth question, 37.5% of the respondents declared they were strongly dissatisfied, while 31.5% of the respondents were dissatisfied. There wasa significantly smaller number of respondents (2%) who strongly agreed with question 4, and only 10.5% of the respondents agreed with question 4. Also, 18.5% of the respondents were neutral, neither satisfied, nor dissatisfied. Regarding the second statement, 17.5% and 25% of the respondents strongly disagreed and disagreed, respectively. There were 4.5% and 19.5% of the respondents who strongly agreed and agreed, respectively, with the second statement. A significant number of respondents were neutral (28%), neither agreed, nor disagreed with question 5. Regarding the third statement, 21% of the respondents strongly disagreed, and 32.5% of the respondents disagree with question 6. Only 4% and 16.5% of the respondents strongly agreed and, respectively, agreed with question 6. However, 26% of the respondents were neutral, neither satisfied, nor dissatisfied at question 6.
Table 2 shows the frequency and percentage for the statements on working condition which is related to teachers’ job satisfaction. The mean value of the first statement is 3.46, the mean value of the second statement is 3.075, and the mean value of the third statement is 3.63. In Table 2, it is seen that 6% of the respondents were strongly dissatisfied, while 12% of the respondents were dissatisfied at question 7. Moreover, 19% and 32% of the respondents strongly agreed and, respectively, agreed with question 7. Also, 31% of the respondents were neutral, neither satisfied, nor dissatisfied. If we note the second statement, 9% and 22.5% of the respondents strongly disagreed and, respectively, disagreed with question 8. Also, 11.5% and 25% of the respondents strongly agreed and, respectively, agreed with question 8, while a significant percentage of respondents (32%) were neutral, neither agreed, nor disagreed. If we notice the third statement, only a few (1.5%) of the respondents strongly disagreed and 9.5% of the respondents disagreed with question 9. A significant percent of respondents (48%) strongly agreed, and 13.5% agreed with question 9, while 27% of the respondents were neutral, neither satisfied, nor dissatisfied.
Table 2 shows the frequency and percentage for the satisfaction level on training and development. This mean value for the statement is 2.92. Thus, 20% of the respondents were strongly dissatisfied and 23.5% of the respondents were dissatisfied on the available training and development programs for teachers. However, 23.5% of the respondents were somewhat satisfied, and only 6% of the respondents were strongly satisfied with their job. Furthermore, 37% of the respondents were neutral; they were neither satisfied, nor dissatisfied with their job training and development. Table 3 explains the frequency and percentage for the job satisfaction level of teachers. There are four statements used to evaluate the satisfaction level on theself-esteem of the teachers. The mean value for the first statement is 4.22, for the second statement it is 3.65, for the third statement it is 2.7, and for the fourth statement it is 3.72.
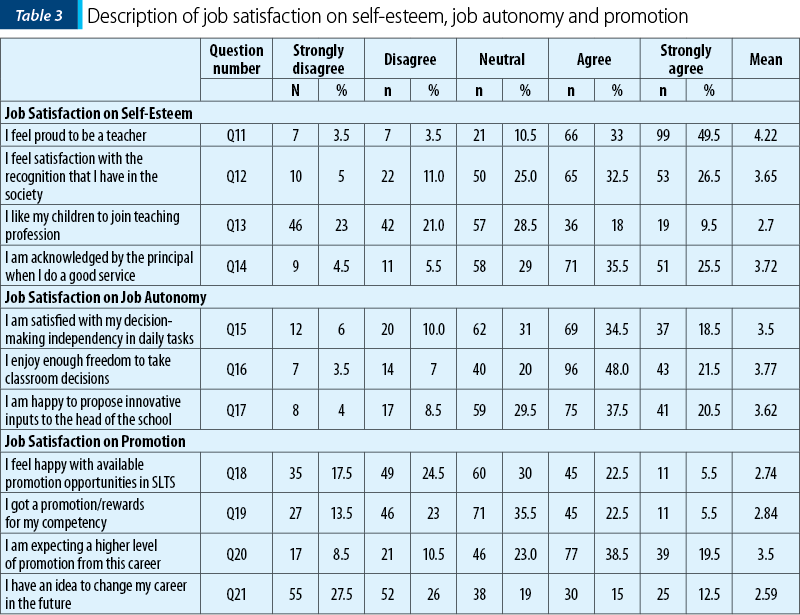
In Table 3, it is observed that, at question 10, there was strongly disagreement and disagreement by very few and for an equal number of respondents, such as 3.5% on each scale. The highest percentage of the respondents (49.5%) strongly agreed at question 10, and 33% of the respondents agreed. Only 10.5% of the respondents were neutral, neither satisfied, nor dissatisfied. Regarding question 11, 5% and 11% of the respondents strongly disagreed and, respectively, disagreed with this question. Also, 32.5% and 26.5% of the respondents agreed and strongly agreed, respectively, with question 11, while 25% of the respondents were neutral, neither agreed, nor disagreed with this question. At the third statement, 23% of the respondents strongly disagreed, and 21% of the respondents disagreed at question 12. Also, 18% and 9.5% of the respondents agreed and, respectively, strongly agreed with question 12. However, a significant number of respondents (28%) were neutral, neither agreed, nor disagreed with question 12. Regarding question 13, there were 4.5% and 5.5% of the respondents who strongly disagreed and, respectively, disagreed with this question, while 35.5% and 25.5% of the respondents, respectively, agreed and strongly agreed. Furthermore, 29% of the respondents were neutral, neither agreed, nor disagreed with question 13.
Table 3 explains the frequency and percentage for the job satisfaction level of teachers. There were three statements used to evaluate the satisfaction level on teachers’ job autonomy. The mean value for the first statement is 3.5, for the second statement it is 3.77, and for the third statement it is 3.62. In Table 3, it is seen that, at question 15, a percentage of 6% of the respondents were strongly dissatisfied and 10% of the respondents were dissatisfied. A significant number of respondents (34.5%) agreed with question 15 and 18.5% of the respondents strongly agreed. Anyhow, 31% of the respondents were neutral, neither satisfied, nor dissatisfied. Regarding question 16, 3.5% and 7% of the respondents strongly disagreed and, respectively, disagreed. Also, 48% and 21.5% of the respondents agreed and, respectively, strongly agreed with the statement. Only 20% of the respondents were neutral regarding question 16. Moving on to question 17, a percentage of 4% of the respondents strongly disagreed and 8.5% of the respondents disagreed with this question. Also, 37.5% and 20% of the respondents agreed and, respectively, strongly agree. However, 29.5% of the respondents were neutral, neither satisfied, nor dissatisfied at question 17.
Table 3 provides details about the frequency and percentage for the job satisfaction level of teachers. There are four statements used to evaluate the satisfaction level on promotion of the teachers. The mean value for the first statement is 2.74, for the second statement it is 2.84, for the third statement it is 3.5, and for the fourth statement it is 2.59. It can be noticed that, at question 18, there were 17.5% of the respondents who strongly disagreed, and 24.5% of the respondents disagreed. Also, 22.5% and 5.5% of the participants agreed and, respectively, strongly agreed at question 18. However, 30% of the respondents were neutral, neither satisfied, nor dissatisfied. Regarding question 19, there were 13.5% and 23% of the respondents who strongly disagreed and, respectively, disagreed with this question. Also, 22.5% and 5.5% of the respondents agreed and, respectively, strongly agreed with question 19. There was a comparatively significant number of respondents (35.5%) who scaled as neutral, neither agreed, nor disagreed with question 19. Regarding question 20, a total of 8.5% of the respondents strongly disagreed and 10.5% disagreed. Also, 38.5% and 19.5% of the respondents agreed and, respectively, strongly agreed with question 20. Moreover, 23% of the respondents were neutral, neither agreed, nor disagreed with this question. Moving on to question 21, there were 27.5% and 26% of the respondents who strongly disagreed and, respectively, disagreed. Also, 15% and 12.5% of the respondents agreed and, respectively, strongly agreed with this question. Furthermore, 19% of the respondents were neutral, neither agreed, nor disagreed with question 21.
Table 4 presents the frequency and percentage for the job satisfaction level of teachers on interpersonal relations. There are four statements used to assess the satisfaction level on interpersonal relations . The mean value for the first statement is 3.68, for the second statement it is 3.78, for the third statement it is 3.8, and for the fourth statement it is 3.83. It can be noticed that, at question 22, very few respondents (3%) strongly disagreed, while 6% disagreed. A significant number of respondents agreed with question 22 (44%), and 18% of the respondentsstrongly agreed. However, 29% of the respondents were neutral, neither satisfied, nor dissatisfied. Regarding question 23, only 2% and 6.5% of the respondents, respectively, strongly disagreed and disagreed at this question. Also, 41.5% and 23.5% of the respondents, respectively, agreed and strongly agreed with question 22. Furthermore, 26.5% of the respondents were neutral, neither agreed, nor disagreed. Regarding question 24, only 1.5% of the respondents strongly disagreed, and 4.5% of the respondents disagreed. Also, 52.5% and, respectively, 17.5% of the respondents agreed and strongly agreed with this question, while 24% of the respondents were neutral, neither agreed, nor disagreed. Moving on to question 25, very few (1.5% and 1%, respectively) of the respondents strongly disagreed and disagreed with the statement. Also, 49.5% and 18.5% of the respondents, respectively, agreed and strongly agreed at question 25. Furthermore, 29.5% of the respondents were neutral, neither agreed, nor disagreed.
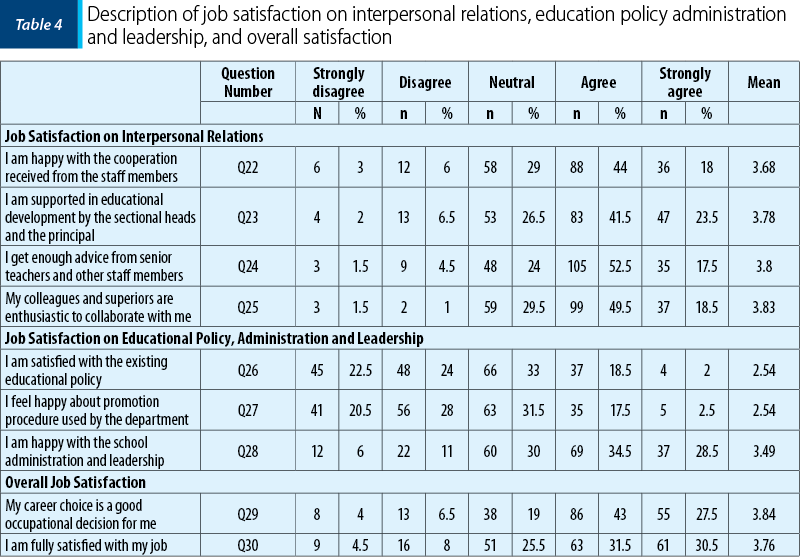
Table 4 shows the frequency and percentage for the job satisfaction level of teachers on educational policy, administration and leadership. Three statements were used to assess the satisfaction level on educational policy, administration, and leadership of the teachers. The mean value for the first statement is 2.54, for the second statement it is 2.54, and for the fourth statement it is 3.49. It can be noticed that 22.5% of the respondents strongly disagreed and 24% of the respondents disagreed with question 26. There were 18.5% and 2% of the respondents who agreed and, respectively, strongly agreed with this question, while 33% of the respondents were neutral, neither satisfied, nor dissatisfied. Regarding question 27, 20.5% and 28% of the respondents strongly disagreed and, respectively, disagreed at this question. Also, 17.5% and 2.5% of the respondents strongly agreed and, respectively, agreed, while 31.5% of respondents were neutral, neither agreed, nor disagreed. Moving on to question 28, there were 6% and 11% of the respondents who strongly disagreed and, respectively, disagreed. Also, 34.5% and 28.5% of the respondents agreed and, respectively, strongly agreed with question 28, while 30% of the respondents were neutral, neither satisfied, nor dissatisfied.
Table 4 explains the frequency and percentage for the overall job satisfaction level of teachers. There are two statements used to find out the overall job satisfaction level. The mean value for the first statement is 3.84, and the mean value for the second statement is 3.76. It can be seen that only 4% of the respondents strongly disagreed, and 6.5% of the respondents disagreed with question 29. There is a high percentage (43%) of the respondents who agreed, and 27.5% of the respondents strongly agreed with this question, while 19% of the respondents were neutral, neither satisfied, nor dissatisfied. Regarding question 30, there were 4.5% and 8% of the respondents who strongly disagreed and, respectively, disagreed. Also, 31.5% and 30.5% of the respondents agreed and, respectively, strongly agreed, while 25.5% were neutral, neither agreed, nor disagreed with question 30.
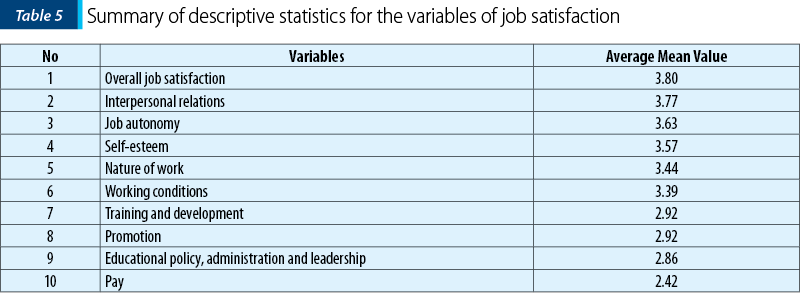
As presented in Table 5, the mean value of each aspect on job satisfaction shows the descriptive analysis results on different aspects of job satisfaction. Interpersonal relation was ranked first with a mean value of 3.77, job autonomy ranked second with a mean value of 3.63, self-esteem ranked third with a mean value of 3.57, nature of work ranked fourth with a mean value of 3.44, working conditions ranked fifth with a mean value of 3.39, promotion, training and development ranked sixth with a similar mean value (2.92), educational policy, administration and leadership ranked eighth with a mean value of 2.86, and payment ranked ninth with a mean value of 2.4. The views of respondents were based on the impact of these variables on job satisfaction. The participants were asked if they were satisfied with the work at all (overall job satisfaction), the answers revealing a mean value of 3.80. This high mean value illustrates that the respondents were satisfied with their work; therefore, they would be more satisfied with their job, if their work and their efforts were more recognized.
Discussion
Teachers are highly satisfied with the nature of their work. We found that the teachers are happy with given responsibilities/timetable, opportunity to use their knowledge, skills and attitude, and not given more co-curricular activities than the classroom teaching. This situation motivates the teachers to be happy with their profession and retain them for long years of service with dedication towards teaching profession. Teachers are strongly dissatisfied with the payment system available for them. More than two-thirds of the teachers strongly disagreed and disagreed with the available payment system. They are not comfortable with the reward and fringe benefits. Also, more than half of the teachers have responded that they were not paid according to their qualification. Pay scale must be reasonable with present socioeconomic conditions. If the teachers feel unhappy with their salary, they will try to make more income by private tuition. There are instances where teachers get more amounts from private teaching than their monthly salary, making teachers less sincere towards their work at school.
Most of the teachers revealed that they are happy with the working condition. More than half of the teachers are highly satisfied with the school teaching and learning environment, and they are feeling comfortable working in the existing school. This factor highly helps to make a successful teaching and learning process, and it gives more positive sense of felling towards their profession. Hence there are almost half of the teachers dissatisfied with the available working conditions in the school setting. It is very important that the authoritative take necessary steps to improve the working condition in the school setting.
Almost all the teachers are having higher job satisfaction on self-esteem towards their profession. There were only seven percentages of the teachers who responded dissatisfied on self-esteem. The participants feel highly proud to be a teacher. They are satisfied with the recognition that they receive from the society. In addition, they were acknowledged by the principal when they do a good service. In contrast, more than two-fifths of the teachers do not like their children to join teaching profession. However, the existing teachers in the profession were highly happy due to this, revealing that this factor has first and foremost correlation on teachers’ job satisfaction.
Teachers are highly dissatisfied with the available training and development. This is the core tool to mold people in any organization. When it comes to school setting, the teachers wanted to handle a very significant target group in the society. For this, they need more training and development to handle them successfully. This research revealed that the respondents were not highly satisfied with the available training and development programs. But it highly influenced teachers’ job satisfaction.
There was a higher number of teachers highly satisfied with job autonomy. They have higher decision-making independency in their class room. More than two-thirds of the respondents were highly happy with this aspect. They like to propose innovative inputs to the head of the school. This is a second influencing factor on teachers’ job satisfaction. It is significant that this factor helps retain teachers in their profession for a long period.
Most of the teachers are expecting reasonable promotion from their profession. But the teachers’ responses revealed that they had poor satisfaction with the available promotion opportunities. Also, they do not have an idea to change their career in thefuture. However, the Table 4, section 27, revealed that there was no significant correlation between promotion and job satisfaction.
Almost all the teachers were strongly satisfied with the interpersonal relation that they had with their colleagues and superiors in the school setting. They are very enthusiastic to collaborate with each other. Interpersonal relation obtained the highest mean score among other independent variables on job satisfaction. Teachers are highly supported in educational development by their colleagues and superiors. On the other hand, it had a poor correlation with the job satisfactions of the teachers. However, this factor helps retain the teachers in their career for a longer period.
The teachers’ responses revealed that they have second least satisfaction on educational policy, administration and leadership, among other independent variables. Nearly half of the respondents were dissatisfied with the existing educational policy, as well as the promotion procedures available in the department. However, the teachers are strongly satisfied with the school administration and leadership. This factor is highly correlating with the job satisfaction.
Conclusions
After examining the factors influencing teachers’ job satisfaction in the Teacher Centre Colombo, the research work concluded that teachers in the provincial government schools had higher job satisfaction from interpersonal relation, job autonomy, self-esteem, and nature of work. Enhancement of job satisfaction with increasing salary scale, developing sound educational policy, administration and leadership, in-service training and development and reasonable promotion opportunity, has significant effects on teachers’ job satisfaction in the provincial government schools in the Colombo Center. Teachers who are serving in provincial schools in Colombo area are satisfied with some other aspects which are not included in this research. The findings revealed moderate positive, weak positive and negligible relationship between factors of satisfaction and teachers’ job satisfaction. This means that the teachers in the provincial schools are more committed to their job when they derive more satisfaction from motivational and hygiene factors.
Hence, the Education Ministry and provincial administrators need to pay special attention to the improvement on payment, fringe benefits, bonuses, promotion opportunities, promotion process and procedures, in-service training, professional growth and appreciation, in order to improve teachers’ satisfaction to retain the valuable teachers and to improve the quality of education in this country.
Suggestions
To increase the quality of teaching profession, to attract high-quality people and to retain the existing valuable teachers. As researchers, we wish to suggest the following (along with an adequate salary scale designed to attract both male and female graduates to the teaching profession):
1. Find out a strong mechanism to attract and retain especially male teachers in the profession, because of the ever-decreasing interest in teaching profession of male population as indicated in the school statistics of theMinistry of Education from Sri Lanka.
2. Teacher service should be appreciated and provided with economic benefits equally with other professional services in the country, such as Sri Lanka Administrative Services (SLAS).
3. Professional advancement opportunity and career progression paths need to become more effective and diverse.
4. Professional development, such as in-service training, should be redesigned to improve the quality of teaching which can match the current needs of the country.
Corresponding author: Faiz M.M.T. Marikar E-mail: faiz@kdu.ac.lk
CONFLICT OF INTEREST: none declared.
FINANCIAL SUPPORT: none declared.
This work is permanently accessible online free of charge and published under the CC-BY.

Bibliografie
-
Darling-Hammond L. Policy for restructuring. In: A. Lieberman A (Ed.). The work of restructuring schools: Building from the ground up. New York: Teachers College Press, 1995, pp. 157-175.
-
Dweck CS. Self-theories: Their role in Motivation, Personality, and Development. Philadelphia, PA: Psychology Press, 1999.
-
Filak VF, Sheldon KM. Student Psychological Need Satisfaction and College Teacher-Course Evaluations. Educational Psychology. 2003;23(3):235-247.
-
Gunram D. The Motivation and Job Satisfaction of Secondary School Teachers in KwaZulu-Natal. PhD dissertation, University of South Africa, 2011.
-
Joyce B, Calhoun, E. The conduct of school renewal: Working hypotheses from successful cases. Paper presented at the annual meeting of the American Educational Research Association, San Diego, CA, April 1998.
-
Latif MS, Ahmad M, Qasim M, Mushtaq M, Ferdoos A, Naeem H. Impact of employee’s job satisfaction on organizational performance. European Journal of Business and Management. 2015;7:166–171.
-
Lieberman A, Grolnick M. Networks and reform in American education. Teachers College Record. 1996;98(1):7-45.
-
Luthans F. Organizational Behavior. McGill Illinois, 1985.
-
Ministry of Education. School Census Preliminary Report, Sri Lanka, 2008.
-
Nyakundi TK. Factors Affecting Teacher Motivation in Pacific Secondary Schools in Thika West District, Kiambu Country. Ministry of Education project, School of Education of Kennyatta University, 2012.
-
Senge P. The fifth discipline. New York: Doubleday, 1990.
-
Shann MH. Professional Commitment and Satisfaction among Teachers in Urban Middle schools. The Journal of Educational Research. 2001;92(2):67-73.
-
Sharif UF, Nazir A. An Investigative Study on Job Satisfaction Level of Employees Working in Software Industry: A View Point of Employees in Pakistan. International Journal of Social Sciences. 2016;2(1):415-432.

Omul portocaliu
Octavian Vasiliu
Cartea doamnei profesor Doina Cozman este rezultatul decantării unei experienţe profesionale de excepţie, care include peste 40 de ani de activitate clinică, terapeutică, de cercetare, pedagogică şi, nu în ultimul rând, literară. ...
Ciudăţenii ale psihiatriei. Observaţii asupra a 50 ani de psihiatrie în România ale unui martor ocular
Mircea Lăzărescu
Această prezentare este realizată de un psihiatru care în ultimii 50 de ani a fost direct implicat în activitatea psihiatriei din România, fiind în acelaşi timp informat privind istoria psihiatriei şi...
Feeling of worthlessness – a cause of attempted suicide in schizophrenia
Lavinia Duică
Pacienta P.E, în vârstă de 54 de ani, divorţată, din mediul rural, pensionată pe caz de boală, cunoscută de mai mulţi ani cu diagnosticul de schizofrenie paranoidă, s-a prezentat în serviciul de urgenţă pentru o tentativă de suicid. ...
Prescription pattern of psychotropic medicines for patients with schizophrenia in a tertiary hospital of southeast Nigeria
Amala Chukwunwike Ofor, Obinna Ikechukwu Ekwunife
Schizofrenia este o povară pentru sănătatea publică şi un tip sever de tulburare mintală, cu un impact semnificativ asupra individului şi societăţii. Farmacoterapia este baza tratamentului, iar prescr...
Social media networks – risk factors for sleep disorders among young people
Andreea Sălcudean, Andreea-Bianca Sasu, Roland-Felix Kollar, Elena‑Gabriela Strete, Oana Neda-Stepan, Virgil Enătescu
Somnul este starea fiziologică de inconştienţă temporară care se diferenţiază de starea de comă prin faptul că este reversibilă la acţiunea unor stimuli senzoriali, auditivi sau tactili. Utilizarea ex...